Bussiness
PEPE slides below key support level: Analyzing the impact

- PEPE’s price declined by more than 10% in the last seven days.
- Most market indicators looked bearish on the memecoin.
PEPE bears heavily dominated the market in the last seven days, as both its daily and weekly charts were red.
The recent price corrections have pushed the memecoin down to a crucial level, which might be a deciding factor for its future. Let’s have a closer look at what’s going on.
PEPE loses key support
CoinMarketCap’s data revealed that PEPE’s price dropped by more than 10% in the last seven days.
In fact, in the last 24 hours alone, the memecoin witnessed an 8% price correction. At the time of writing, the memecoin was trading at $0.00001082 with a market capitalization of over $4.55 billion.
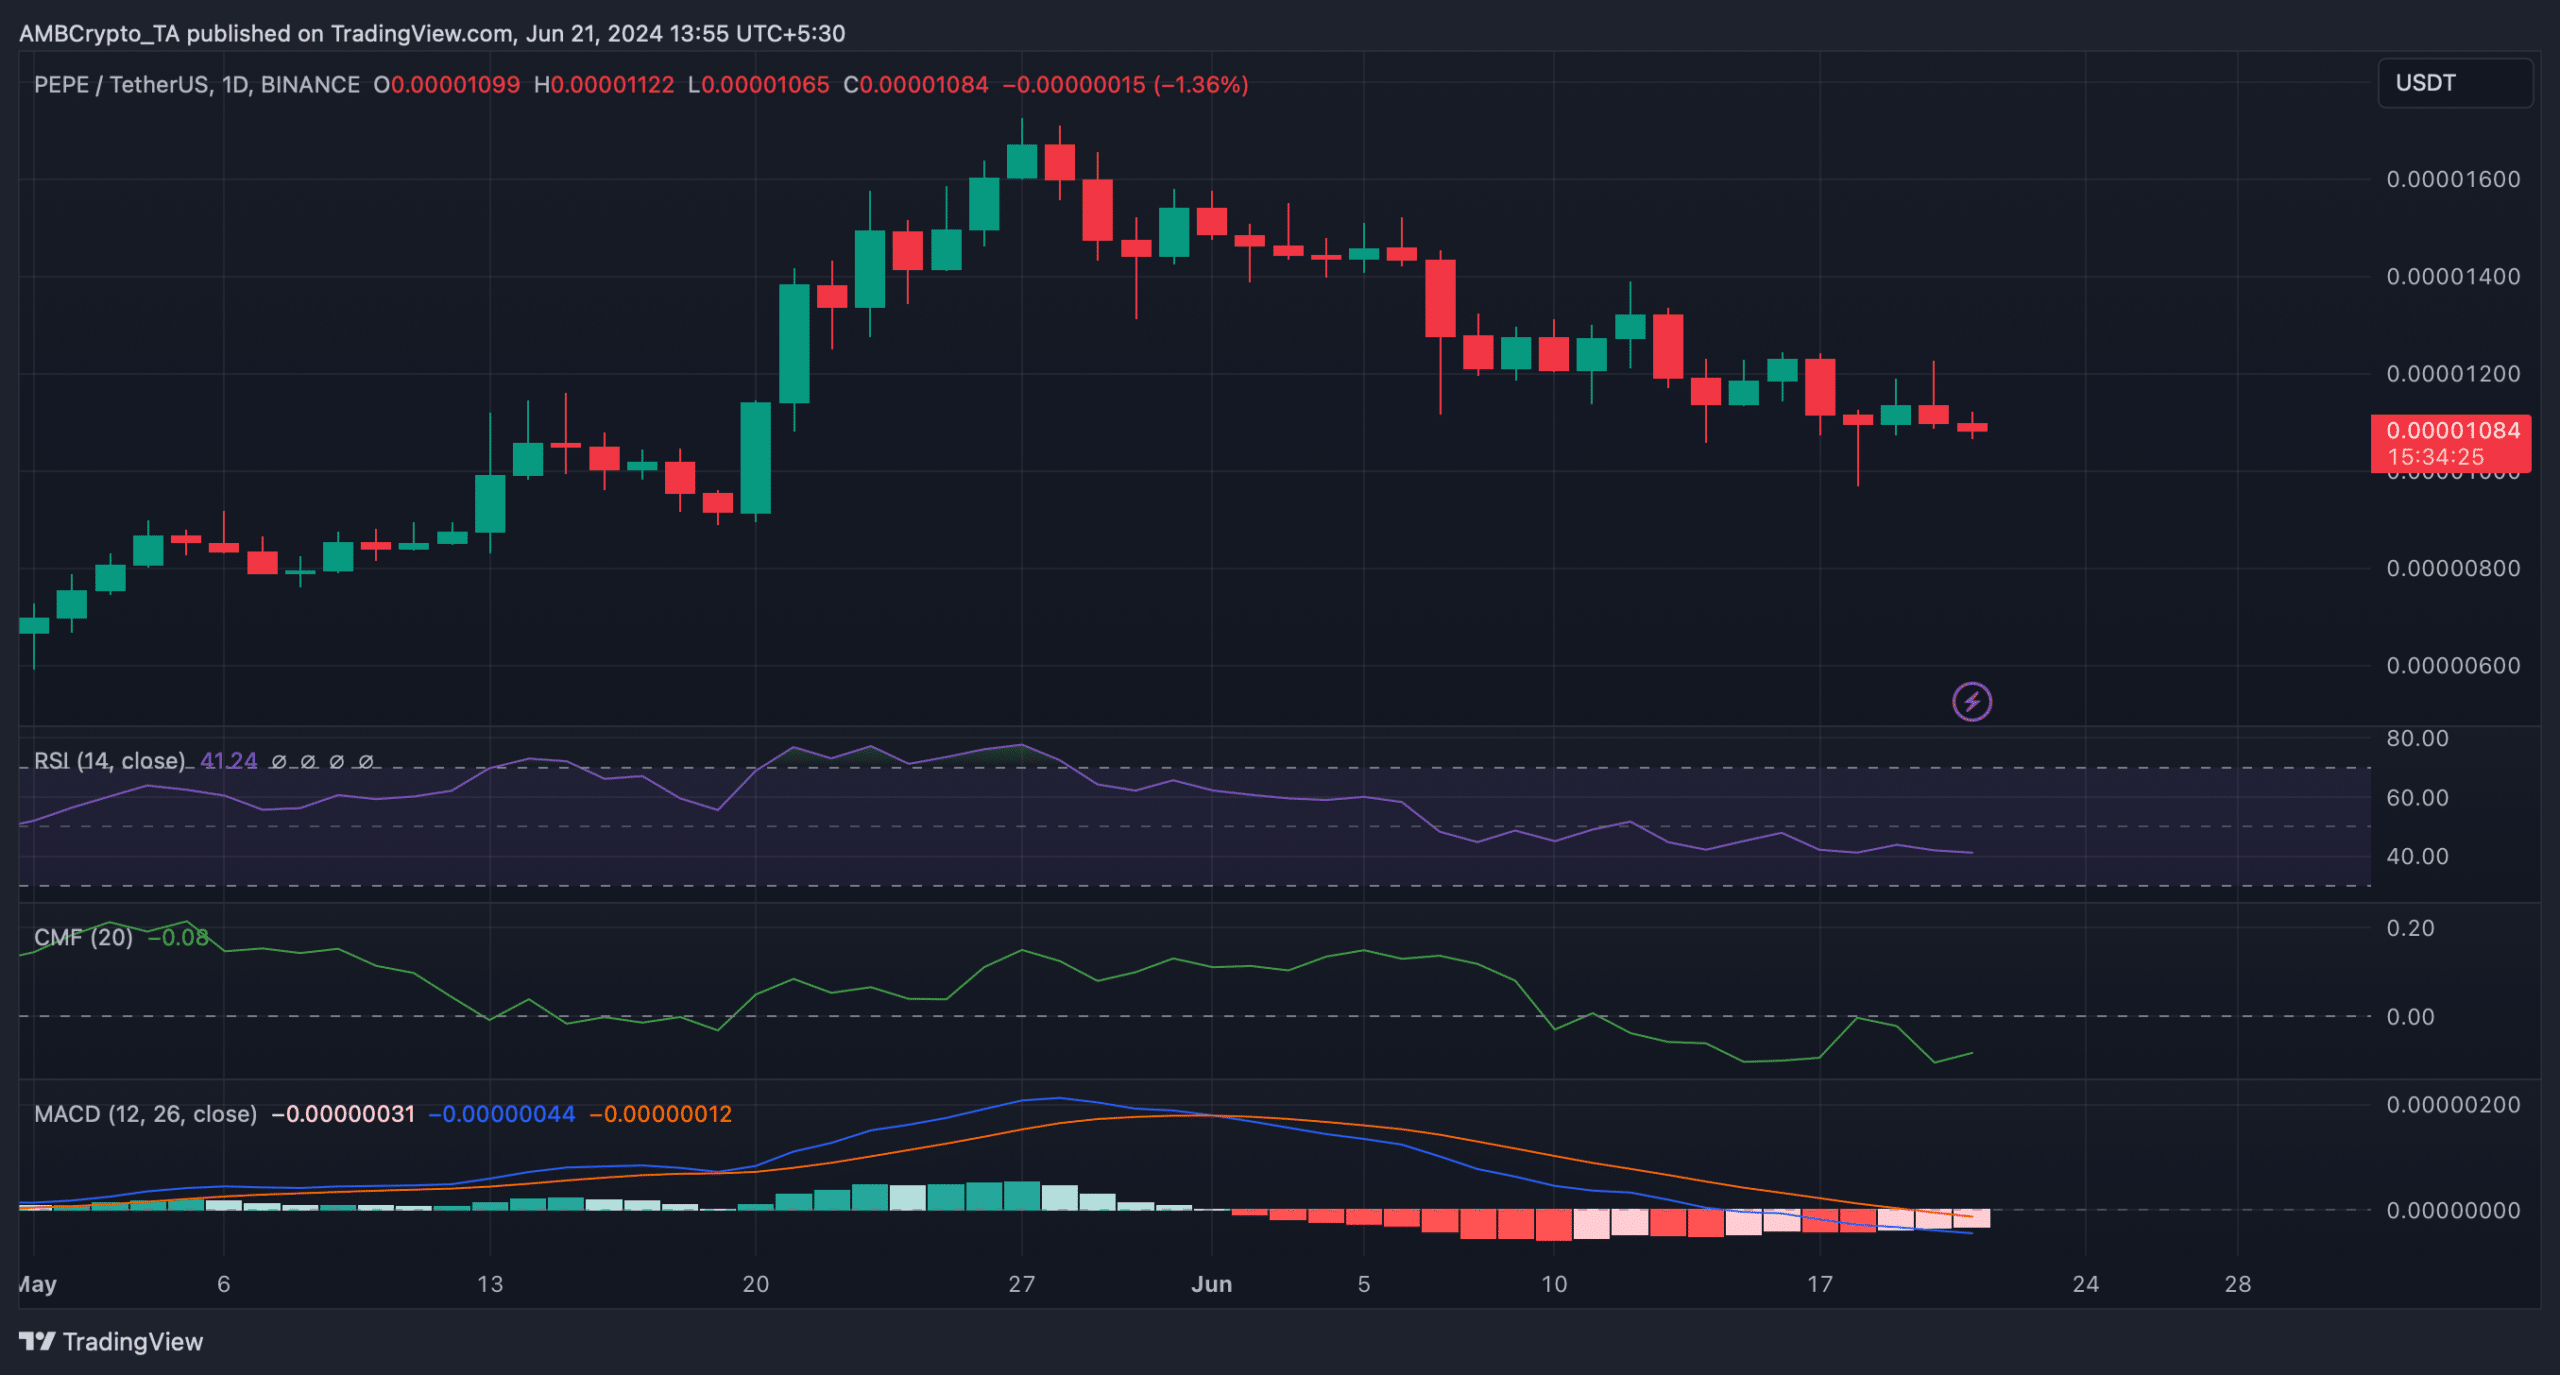
This price correction has pushed the memecoin down from a critical support level of $0.00001083.
The recent dip could be disastrous for the memecoin’s value, as the chances of the bearish trend continuing seemed high.
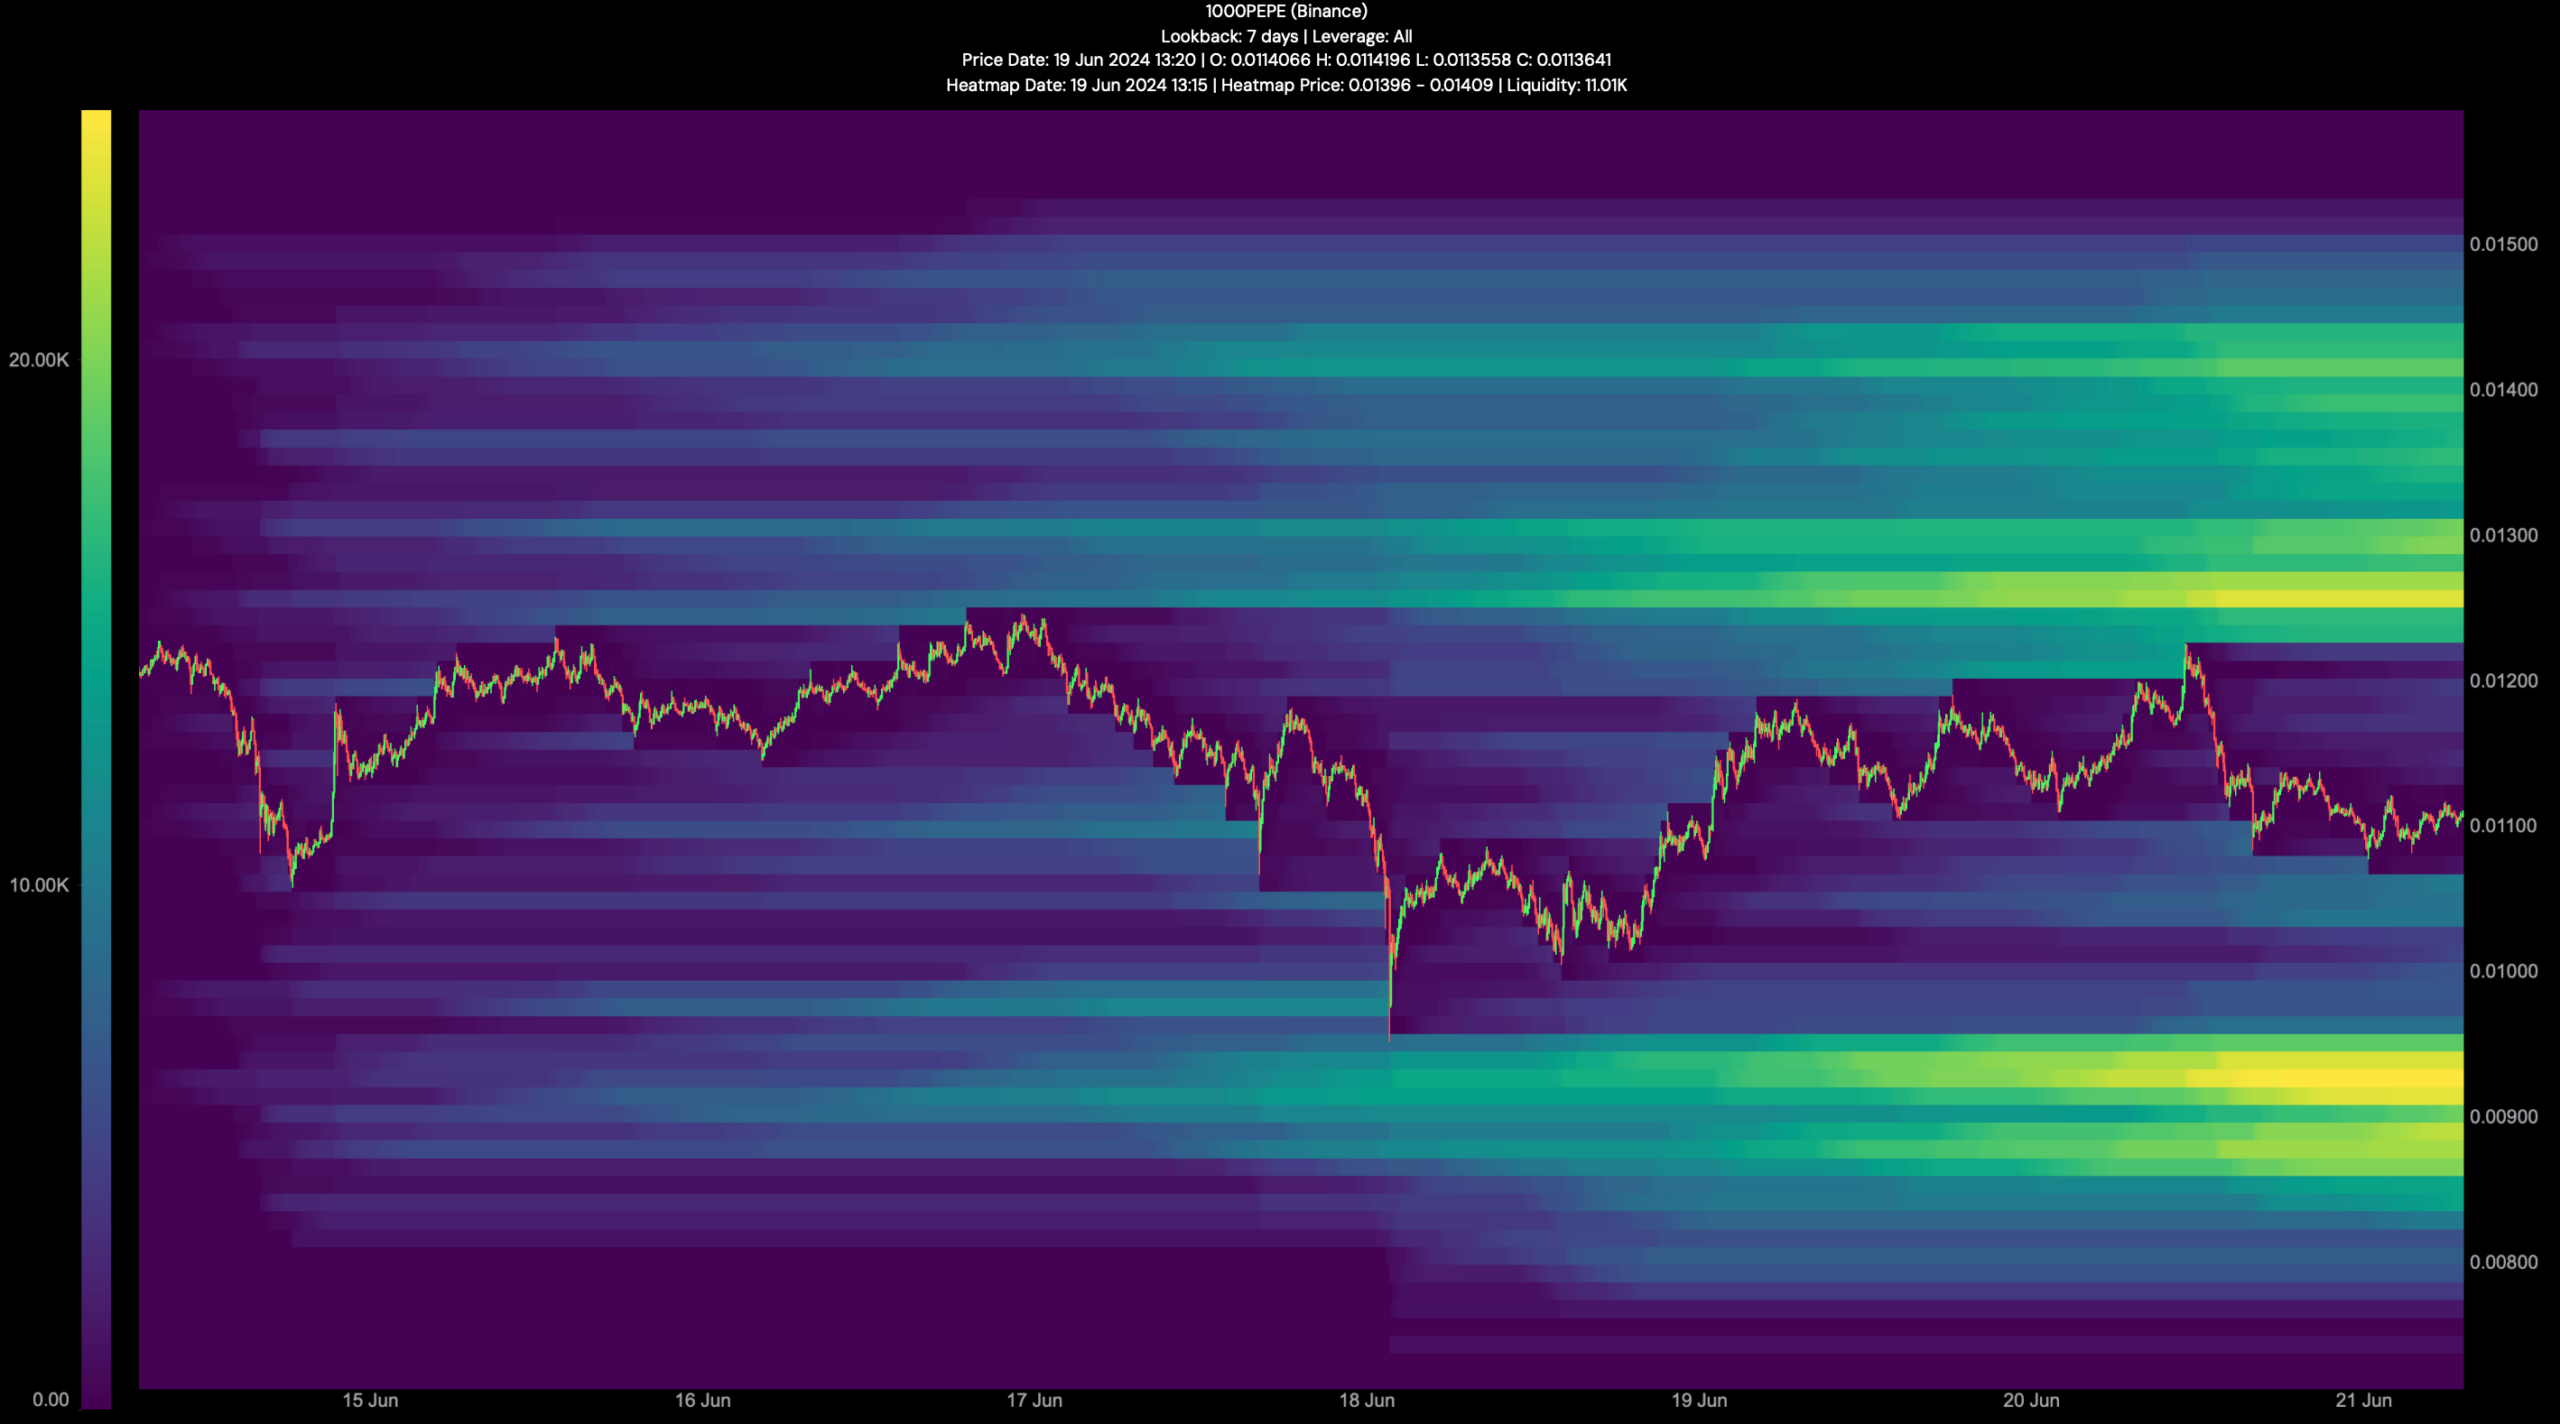
AMBCrypto’s analysis of Hyblock Capital’s data revealed that if bears dominate, then investors might see PEPE plummet to $0.00000932 as liquidation would rise at that level.
A drop from that support could lead to PEPE touching $0.000008. Nonetheless, if the trend changes and the bulls step up their game, then PEPE might touch $0.000012 in the coming days or weeks.
What to expect from PEPE?
AMBCrypto then analyzed the memecoin’s on-chain data to better understand which way it was headed.
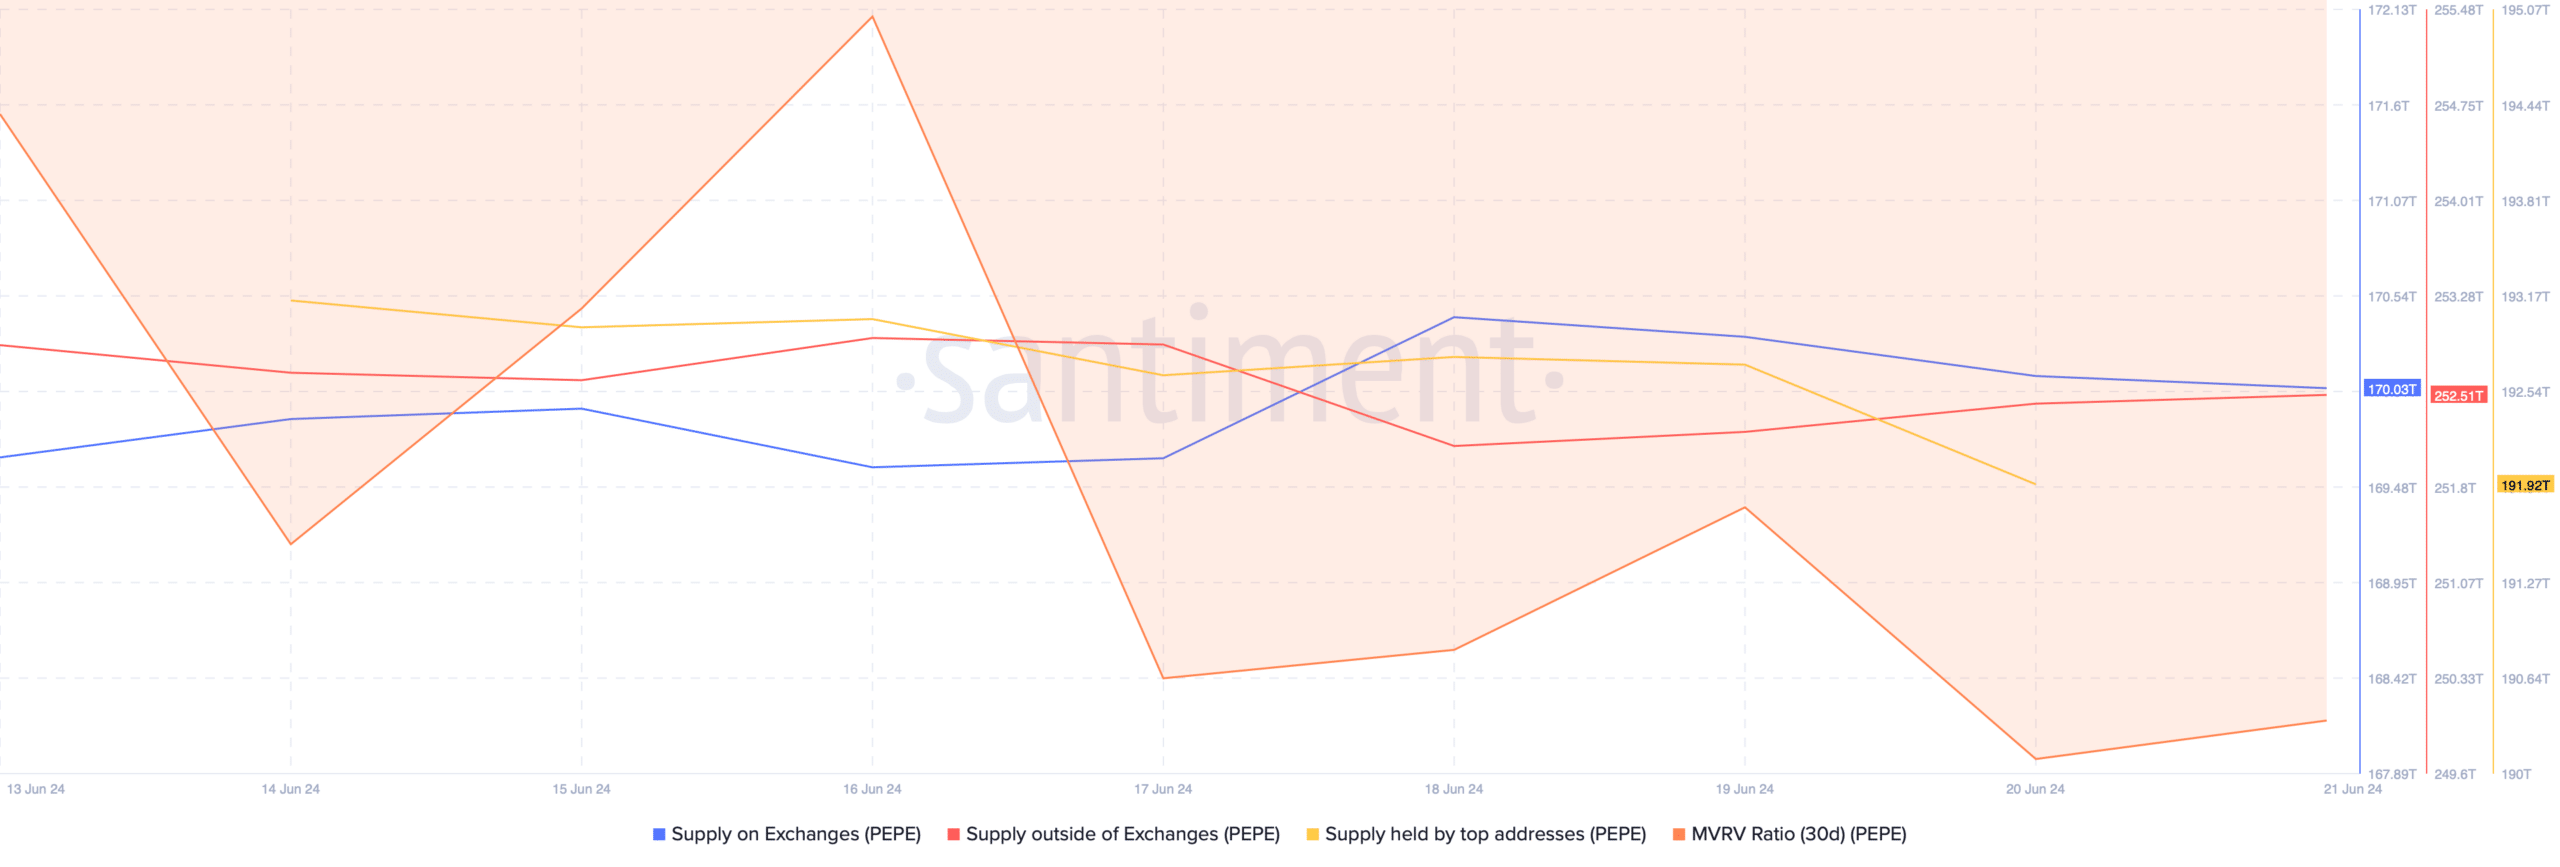
Our analysis of Santiment’s data revealed that the memecoin’s MVRV ratio dropped sharply, which can be inferred as a bearish signal.
However, selling pressure on PEPE was declining. This was evident from the recent drop in supply on exchanges and a rise in its supply outside of exchanges.
But the whales were not confident in the memecoin as the supply held by top addresses graph moved southwards. Unlike whales, retail investors’ confidence in PEPE witnessed a rise.
AMBCrypto reported earlier that the memecoin’s weighted sentiment increased, meaning that bullish sentiment around the memecoin was on the rise.
Read Pepe’s [PEPE] Price Prediction 2024-25
We then planned to take a look at the memecoin’s daily chart to see what market indicators suggested. We found that the technical indicator MACD displayed a clear bullish advantage in the market.
The Relative Strength Index (RSI) registered a downtick, indicating that the possibility of a continued price decline was high. Nonetheless, the Chaikin Money Flow (CMF) looked bullish as it moved northwards on the 20th of June.


)


